Term Info Queries Reference
Every pre-defined query offered in the Term Info pane: which entities show it, what it returns, and what each results column means.
The Term Info pane offers a set of ready-made queries relevant to the currently selected entity. Each query finds related entities (neurons, images, datasets, publications, stocks…) or related data (connectivity, expression, transcriptomics) and shows them in a sortable, filterable results table.
Queries are specialised by entity type: the query menu for a brain region is not the same as the menu for an individual EM neuron, a driver line, a gene, a template or a publication. This page is the complete reference to those queries — use it to understand what a query does before running it, and what its results columns mean.
How queries work
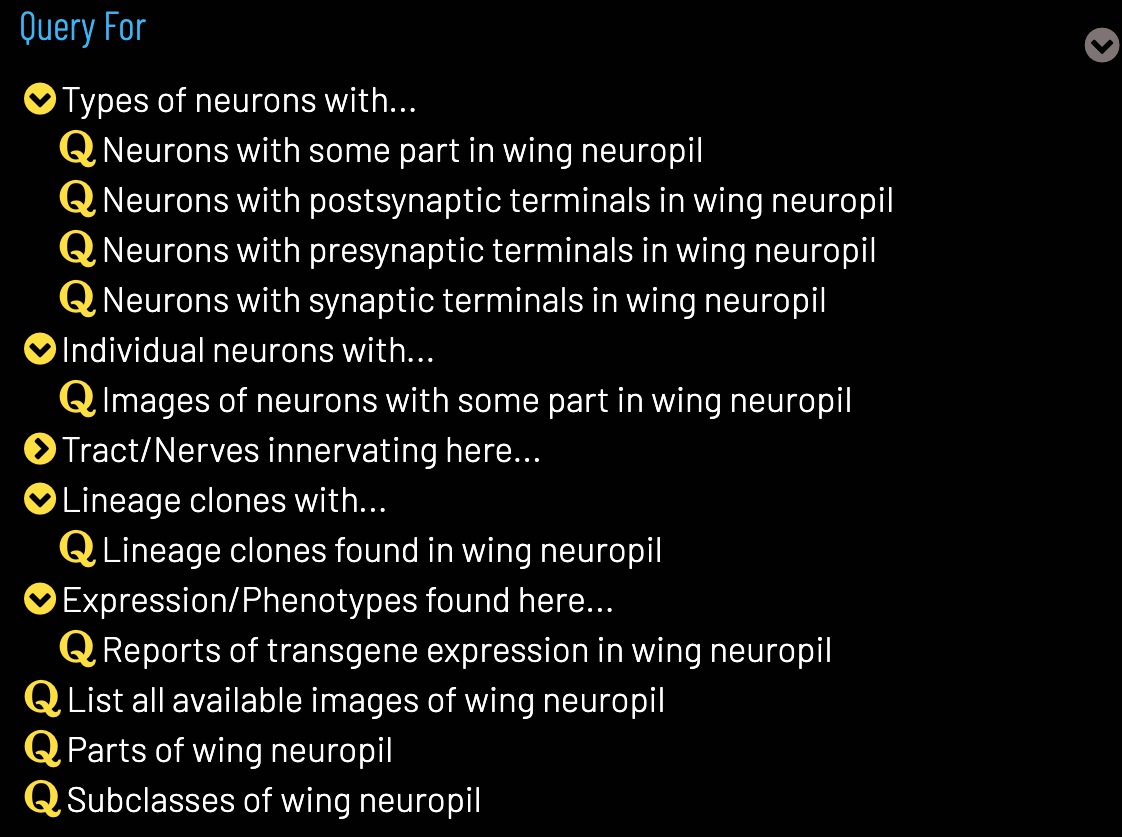
- Queries appear as a menu in the Term Info pane, offered according to the type of the selected entity — the menu for a brain region differs from that for a neuron, driver line, gene or template. A number badge on each query shows how many results it has for the current term; this can be 0 when the term has no matching results (for example a region with no annotated subclasses or clones).
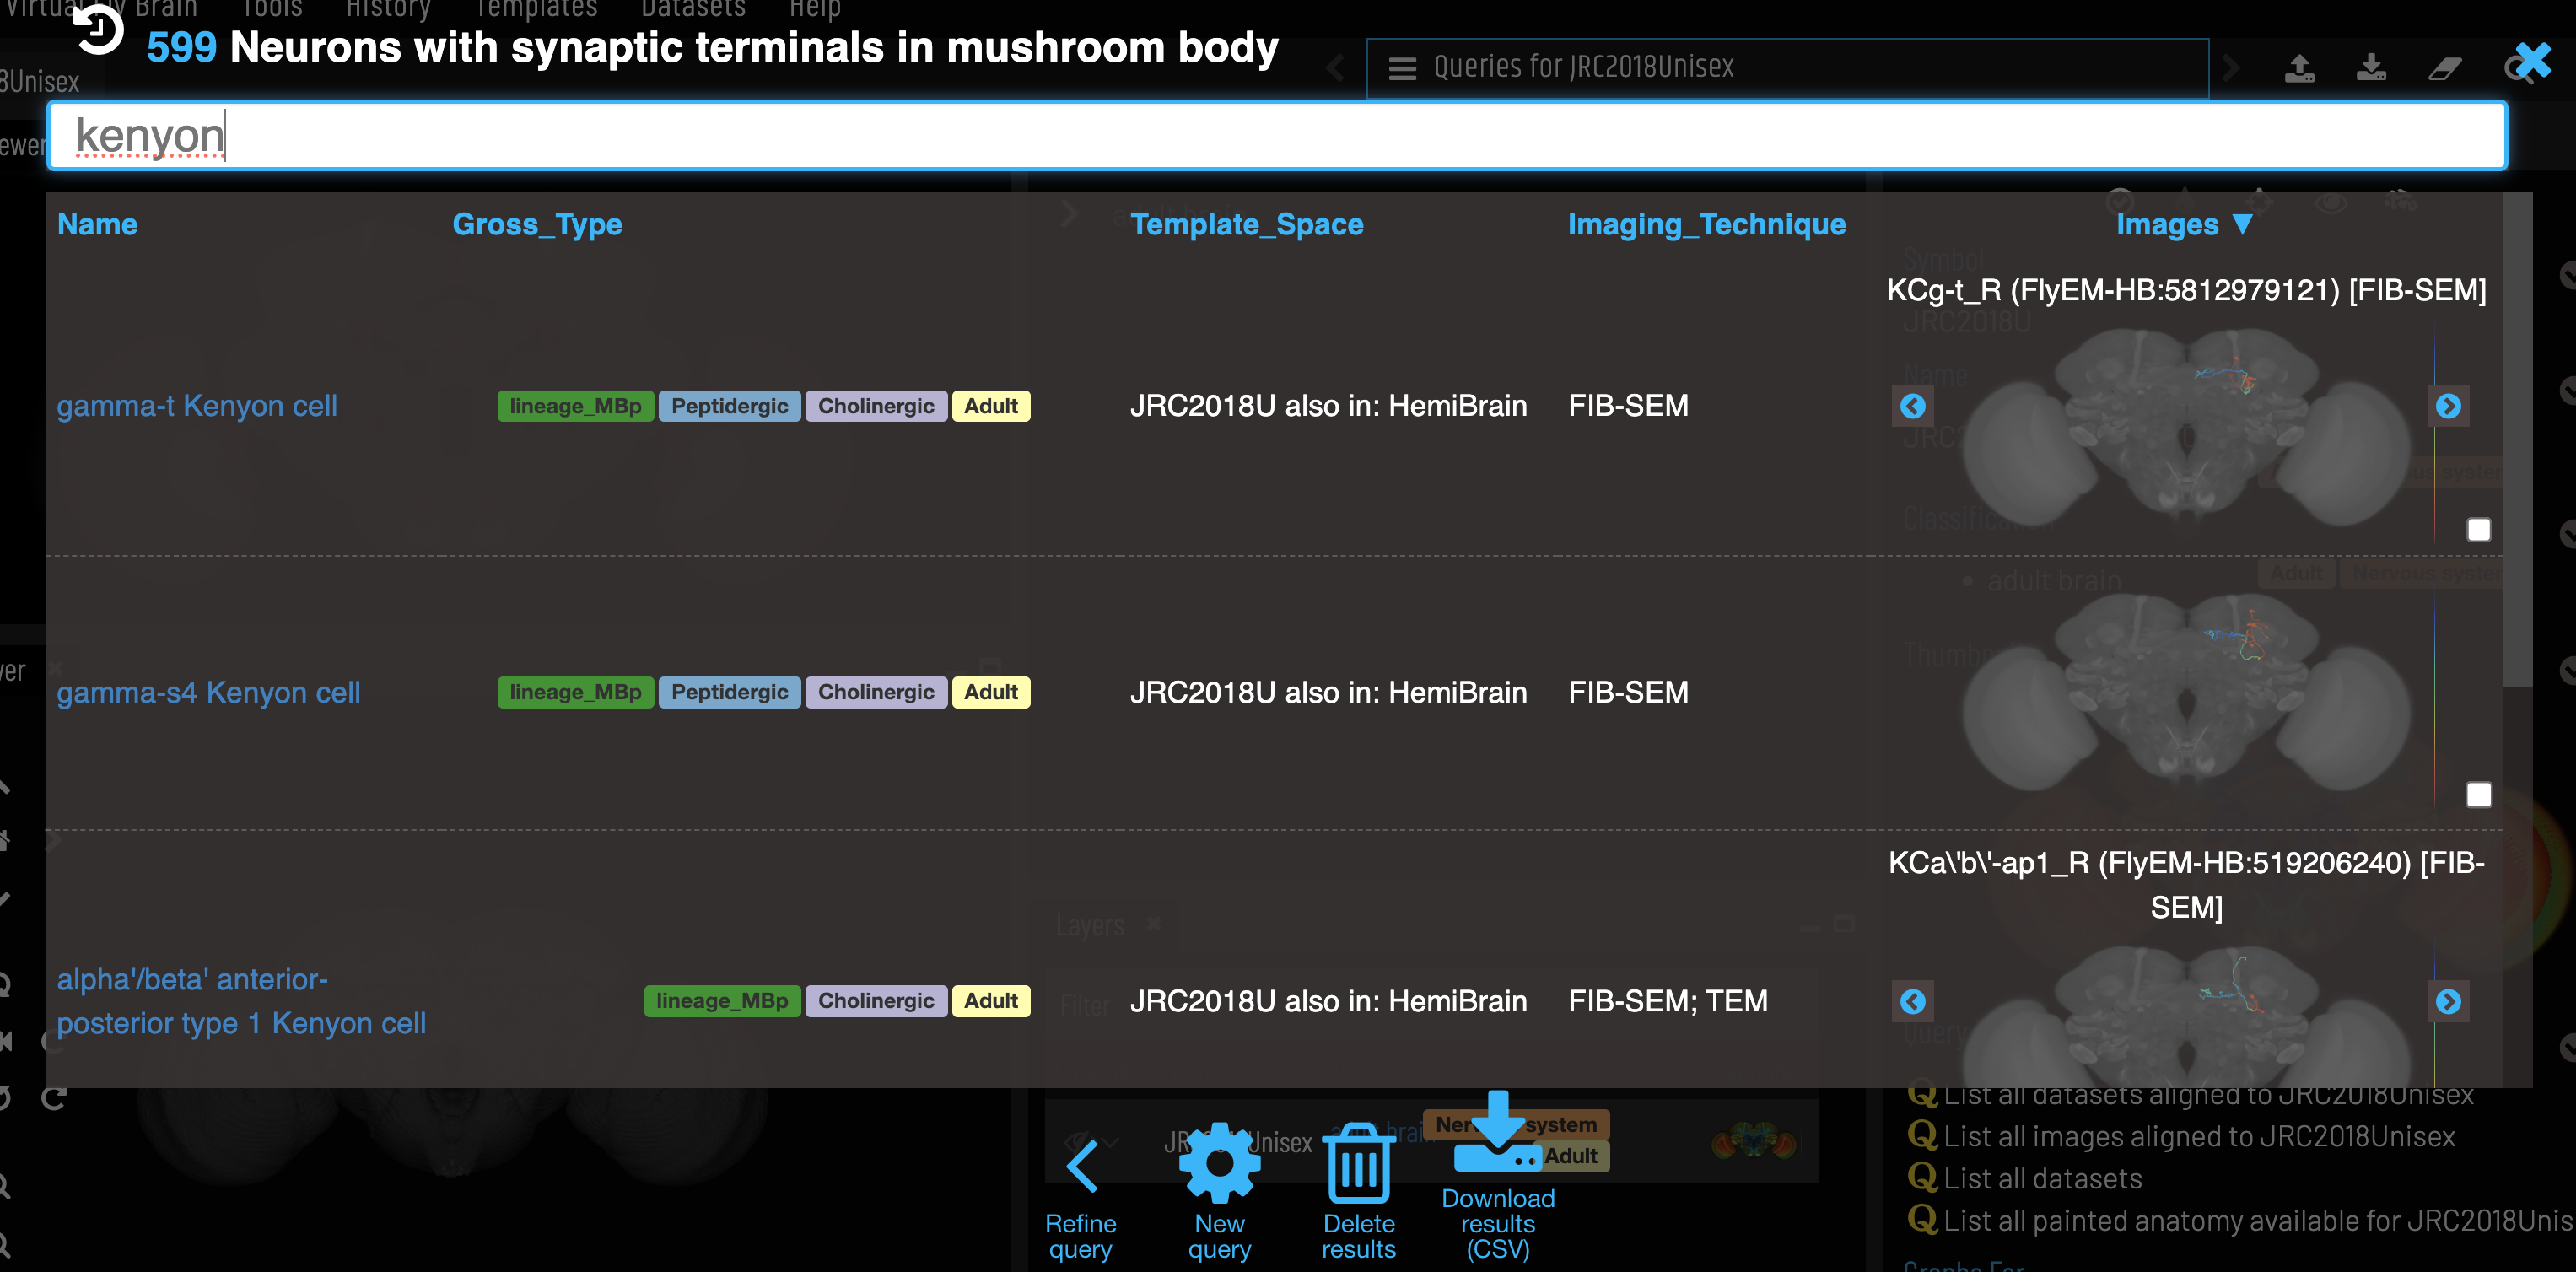
- Selecting a query runs it and opens the results in a table. Results can be filtered by typing in the top bar and sorted by clicking a column header. Clicking a term in the results — the name in the first column, or any highlighted term elsewhere in a row — opens its Term Info. Where images are available, a thumbnail is shown and can be clicked to add the image to the 3D viewer; the checkboxes next to the thumbnails let you add or remove several images to/from the viewer at once.
- The query menu shows a short label with the entity’s name filled in, e.g. “Neurons with some part in medulla”. In the sections below the entity name is written as [term].
- Some individuals inherit their class’s queries — but not all. An individual image is offered its parent class’s queries only when it is one of these anatomical types: painted domain, synaptic neuropil (or its domains and subdomains), tract or nerve, split, expression pattern, or muscle. For those, it shows the queries its class shows, run on the class. Other individuals — in particular individual cells and neurons (e.g. EM reconstructions) — do not inherit their class’s queries; they get only the individual-level queries listed under Individual neurons & images.
Each query below lists the columns in its results table; for what those columns mean, see Result columns explained at the foot of this page.
Queries are powered by the open-source VFBquery engine, which is also reachable programmatically — see APIs.
Anatomy: regions, neuropils, tracts, nerves & clones
These queries appear on anatomical class pages — brain regions, synaptic neuropils, tracts and nerves, clones and other structures. They do not appear on individual cell types (neurons, glia): see Neuron types.
List all available images of [term]
All images (individuals) of an anatomical class. Shown on: anatomy classes. Columns: Name, Parent Type, Gross Types, Template, Data Source, Dataset, License, Thumbnail.
Parts of [term]
Anatomical sub-parts of the structure (part_of).
Shown on: anatomy classes (not individual cells or expression patterns).
Columns: Name, Tags, Template, Imaging Technique, Thumbnail.
Neurons with some part in [term]
Neuron classes with any part overlapping the region. Shown on: anatomy / synaptic-neuropil classes (not cells or expression patterns). Columns: Name, Tags, Template, Imaging Technique, Thumbnail.
Neurons with synaptic terminals in [term]
Neuron classes with synaptic terminals (of either polarity) in the region. Shown on: nervous-system anatomy classes (not cells). Columns: Name, Tags, Template, Imaging Technique, Thumbnail.
Neurons with presynaptic terminals in [term]
Neuron classes with presynaptic (output) terminals in the region. Shown on: nervous-system anatomy classes (not cells). Columns: Name, Tags, Template, Imaging Technique, Thumbnail.
Neurons with postsynaptic terminals in [term]
Neuron classes with postsynaptic (input) terminals in the region. Shown on: nervous-system anatomy classes (not cells). Columns: Name, Tags, Template, Imaging Technique, Thumbnail.
Images of neurons with some part in [term]
Individual neuron images (instances) with a part in the region — the image counterpart of Neurons with some part in. Shown on: anatomy / synaptic-neuropil classes (not cells). Columns: Name, Tags, Template, Imaging Technique, Thumbnail.
Tracts/nerves innervating [term]
Tracts and nerves that innervate the neuropil. Shown on: synaptic neuropils and their domains. Columns: Name, Tags, Template, Imaging Technique, Thumbnail.
Lineage clones found in [term]
Lineage clones overlapping the neuropil. Shown on: synaptic neuropils and their domains. Columns: Name, Tags, Template, Imaging Technique, Thumbnail.
Neurons fasciculating in [term]
Neuron classes that fasciculate with (run along) the tract or nerve. Shown on: tract / nerve classes. Columns: Name, Tags, Template, Imaging Technique, Thumbnail.
Components of [term]
The component parts of a clone. Shown on: clone classes. Columns: Name, Tags, Template, Imaging Technique, Thumbnail.
Transgene expression in [term]
Transgenes/driver lines reported to be expressed in the region or neuron type. Shown on: nervous-system anatomy classes and neuron types. Columns: Expression Pattern, Expressed_in, Publications, Tags, Template, Imaging Technique, Thumbnail.
scRNAseq data for [term]
Single-cell transcriptomics clusters and datasets for the anatomical region. Shown on: anatomy classes that have scRNAseq data. Columns: Cluster, Cell type, Dataset, Publications, Tags.
Neuron types (classes)
Neuron classes are also anatomical classes, so they additionally offer List all available images, Subclasses of, Transgene expression in and, where data exists, scRNAseq data for.
Downstream connectivity classes for [term]
Neuron classes that receive synapses from this neuron class, aggregated over the ontology hierarchy. Shown on: neuron classes. Columns: Upstream Class, Downstream Class, Total N, Connected N, % Connected, Pairwise Connections, Total Weight, Avg Weight.
Upstream connectivity classes for [term]
Neuron classes that send synapses to this neuron class, aggregated over the ontology hierarchy. Shown on: neuron classes. Columns: Upstream Class, Downstream Class, Total N, Connected N, % Connected, Pairwise Connections, Total Weight, Avg Weight.
Splits targeting [term]
Split-GAL4 driver lines that specifically target this neuron type. Shown on: neuron classes. Columns: Name, Tags, Template, Imaging Technique, Thumbnail.
Split drivers, neuroblasts & process terms
Neurons targeted by [term]
Neuron types targeted by a split-GAL4 driver line. Shown on: split (intersectional driver) classes. Columns: Name, Tags, Template, Imaging Technique, Thumbnail.
Images of neurons that develop from [term]
Individual neuron images that develop from a neuroblast. Shown on: neuroblast classes. Columns: Name, Tags, Template, Imaging Technique, Thumbnail.
Neurons capable of [term]
Individual neurons capable of a process — e.g. neurons capable of secreting a particular neurotransmitter. Shown on: neurotransmitter-secretion (GO) process terms. Columns: Name, Tags, Template, Imaging Technique, Thumbnail.
Subclasses of [term]
Direct subclasses of a class. Shown on: any class that has subclasses. Columns: Name, Tags, Template, Imaging Technique, Thumbnail.
Individual neurons & images
These appear on individual neuron pages (e.g. EM reconstructions and registered LM images), depending on the data each neuron carries.
Neurons connected to [term]
Synaptic partners of this neuron, with per-partner input and output synapse counts. Shown on: individual neurons with connectivity data. Columns: Partner Neuron, Type, Outputs, Inputs, Template, Imaging Technique, Tags, Thumbnail.
Connectivity per region for [term]
This neuron’s synaptic terminal counts broken down by brain region. Shown on: individual neurons with regional connectivity data. Columns: Brain Region, Type, Presynaptic Terminals (T-bars), Downstream Synapses, Postsynaptic Terminals, Template, Imaging Technique, Tags, Thumbnail.
Individual neurons with connectivity data can also be added to the Circuit Browser to explore connectivity interactively.
Similarity queries
NBLAST and NeuronBridge find entities with similar morphology. Which of these is offered depends on the similarity data a neuron or expression pattern carries. All are sorted by score, best match first.
Neurons with similar morphology to [term] [NBLAST]
NBLAST matches to an individual neuron. Shown on: individual neurons with NBLAST data. Columns: Score, Name, Tags, Type, Source, Source ID, Template, Imaging Technique, Thumbnail.
Expression patterns with similar morphology to part of [term] [NBLAST]
NBLAST matches from a neuron to expression patterns. Shown on: individual neurons with expression-pattern NBLAST data. Columns: Expression Pattern, NBLAST Score, Tags, Template, Imaging Technique, Thumbnail.
Neurons with similar morphology to part of [term] [NBLAST]
The reverse: NBLAST matches from an expression pattern to neurons. Shown on: individual expression patterns / fragments with NBLAST data. Columns: Neuron, NBLAST Score, Tags, Template, Imaging Technique, Thumbnail.
Expression patterns matching [term] [NeuronBridge]
NeuronBridge matches from a neuron to driver/expression images. Shown on: individual neurons with NeuronBridge data. Columns: Match, NB Score, Tags, Template, Imaging Technique, Thumbnail.
Neurons matching [term] [NeuronBridge]
The reverse: NeuronBridge matches from an expression pattern to neurons. Shown on: individual expression patterns / fragments with NeuronBridge data. Columns: Match, NB Score, Tags, Type, Template, Imaging Technique, Thumbnail.
Neurons with similar morphology to your upload [term] [NBLAST]
NBLAST matches to a neuron you have uploaded. Shown on: user-uploaded neuron data. Columns: Match, Score.
Expression patterns & driver lines
Images of fragments of [term]
Individual expression-pattern fragment images belonging to an expression pattern. Shown on: expression-pattern classes. Columns: Name, Tags, Template, Imaging Technique, Thumbnail.
Anatomy where [term] is expressed
Anatomical classes in which an expression pattern (or fragment) is expressed. Shown on: expression-pattern and expression-pattern-fragment classes. Columns: Anatomy, Publications, Tags, Stage, Template, Imaging Technique, Thumbnail.
Expression patterns also offer the reverse similarity queries Neurons with similar morphology to part of [NBLAST] and Neurons matching [NeuronBridge].
Genes
Clusters expressing [term]
Single-cell transcriptomics clusters that express the gene. Shown on: gene classes with scRNAseq data. Columns: Cluster, Cell type, Expression Level, Expression Extent, Tags.
Genes (and other FlyBase features) also offer Find fly stocks.
Single-cell transcriptomics
Genes expressed in [term]
Genes expressed by a scRNAseq cluster, with expression level and extent. Shown on: scRNAseq clusters. Columns: Gene, Cell type, Expression Level, Expression Extent, Tags, Function.
Clusters in dataset [term]
All clusters in a single-cell RNA-seq dataset. Shown on: scRNAseq datasets. Columns: Cluster, Cell type, Tags, Publications.
See also scRNAseq data for [term] on anatomy pages.
Templates
Template brains are the reference spaces images are aligned to.
Painted domains for [term]
The painted anatomical domains defined in the template. Shown on: template brains. Columns: Domain, Type, Definition, Thumbnail.
All images aligned to [term]
Every image registered to the template’s coordinate space. Shown on: template brains. Columns: Image, Tags, Type, Template, Imaging Technique, Thumbnail.
Datasets aligned to [term]
Datasets with images aligned to the template. Shown on: template brains. Columns: Dataset, Reference, Tags, License, Template, Imaging Technique, Thumbnail, Image_count.
All available datasets
Every dataset available in VFB (offered from any template page). Shown on: template brains. Columns: Dataset, Reference, Tags, License, Template, Imaging Technique, Thumbnail, Image_count.
Datasets
Images in dataset [term]
All images belonging to a dataset. Shown on: datasets that contain images. Columns: Image, Tags, Type, Template, Imaging Technique, Thumbnail.
scRNAseq datasets also offer Clusters in dataset.
Publications
Terms referencing [term]
Entities (terms and images) that cite the publication. Shown on: publications. Columns: Term, Reference type, Tags, Type, Template, Imaging Technique, Thumbnail.
FlyBase features & stocks
Available on FlyBase feature pages (genes, alleles, insertions, constructs, combinations and stocks).
Find fly stocks for [term]
Available fly stocks for the feature, sourced from FlyBase.
Shown on: FlyBase features (FBgn, FBal, FBti, FBtp, FBco, FBst) and
expression patterns driven by them.
Columns: Stock ID, Stock Number, Genotype, Collection.
Find publications for [term]
Publications for a split-GAL4 combination, from FlyBase.
Shown on: FlyBase combination (FBco) features.
Columns: FBrf, Title, Year, Reference, Type, DOI, PMID, PMCID.
Result columns explained
The header shown above each results column is a human-readable title, not the underlying data key. The same kind of data can appear under slightly different headers depending on the query — for example the classification badges are headed Tags in most tables but Gross Types in “List all available images”. As the site is progressively updated some tables may still show older header names (for example Gross Type for Tags, or Template Space for Template); the equivalences are noted below.
Columns in most tables
| Header (and variants) | Meaning |
|---|---|
| Name — also Image, Anatomy, Cluster, Gene, Term, Neuron, Domain, Dataset, Expression Pattern, Match | The result’s name, linked to its Term Info. The exact header names what the query returns. |
| Tags — also Gross Types, Gross Type | Classification badges for the result (e.g. Adult, Neuron, Nervous_system). |
| Type / Parent Type | The class the result is an instance of / its parent class. |
| Thumbnail — also Images | Preview image(s) of the result, aligned to a template. Click to add to the 3D viewer. |
| Template — also Template Space | The template brain space the image is registered/aligned to. |
| Imaging Technique | The imaging or reconstruction technique used (e.g. confocal microscopy, EM). |
| Publications — also Reference | The publication(s) that are the source of, or reference for, the result. |
| Data Source | The database/dataset the record was drawn from. |
| Dataset | The dataset the result belongs to. |
| License | The data-usage licence the result is released under. |
| Stage | The developmental stage(s) the result applies to. |
| Definition | A short definition of the result. |
Similarity columns
| Header | Meaning |
|---|---|
| Score / NBLAST Score / NB Score | Morphological-similarity score to the queried entity; higher = more similar. Tables are sorted by score, highest first. |
NBLAST scores the 3D shape/branching similarity between two neurons. NeuronBridge finds cross-modality shape matches between light-microscopy (driver/expression) images and EM neurons. See Similarity queries.
Connectivity columns
Per-partner and per-region (individual neurons):
| Header | Meaning |
|---|---|
| Partner Neuron | The synaptic partner of the queried neuron. |
| Outputs | Synapses from the queried neuron to the partner (queried neuron presynaptic). |
| Inputs | Synapses from the partner to the queried neuron (partner presynaptic). |
| Brain Region | The region in which the counts are reported. |
| Presynaptic Terminals (T-bars) | The queried neuron’s presynaptic (output) terminals in that region. |
| Downstream Synapses | Downstream postsynaptic terminals on partner neurons in that region (one presynaptic terminal can connect to several). |
| Postsynaptic Terminals | The queried neuron’s postsynaptic (input) terminals in that region. |
Per-class (neuron classes) — each row is a presynaptic class → postsynaptic class pair, rolled up over the ontology’s subclass hierarchy:
| Header | Meaning |
|---|---|
| Upstream Class | The presynaptic (source) neuron class. |
| Downstream Class | The postsynaptic (target) neuron class. |
| Total N | Total neurons in the presynaptic side — i.e. the Upstream Class — whether connected or not (the denominator). For downstream connectivity this is the queried class’s own instance count; for upstream connectivity it is the partner class’s instance count. |
| Connected N | How many of those Upstream-Class neurons actually take part in the connection. |
| % Connected | Connected N ÷ Total N × 100 (i.e. the proportion of the Upstream Class that is connected). |
| Pairwise Connections | Number of distinct neuron-to-neuron connection pairs between the two classes. |
| Total Weight | Total synapses summed over those pairwise connections. |
| Avg Weight | Mean synapses per connected pair (Total Weight ÷ Pairwise Connections). |
Because class-level rows roll up over the subclass hierarchy, a single raw connection can appear in more than one row, so per-row counts do not sum to a simple grand total.
Expression & transcriptomics columns
| Header | Meaning |
|---|---|
| Expressed_in | The anatomical structure(s) where a reported transgene is expressed. |
| Expression Level | Relative/mean expression magnitude of a gene in a cluster (scale is dataset-defined). |
| Expression Extent | Proportion of cells in a cluster that express the gene. |
| Function | Functional category labels for a gene (e.g. neurotransmitter/receptor roles). |
| Cell type | The anatomy / cell type a cluster is “composed primarily of”. |
A cluster is a group of single cells with similar transcriptomes identified in a single-cell RNA-seq (scRNAseq) dataset, taken to represent one cell type.
Publication & stock columns
| Header | Meaning |
|---|---|
| Reference type | How a term cites a publication: Reference, Expression, or both. |
| Stock ID | VFB/FlyBase identifier of a fly stock. |
| Stock Number | The stock-centre catalogue number used to order the stock. |
| Genotype | The full genotype of the stock. |
| Collection | The stock collection/centre that holds the stock (e.g. Bloomington). |
| FBrf | FlyBase reference identifier (FBrf…) of a publication. |
| Title / Year / Type | Title, year and type (paper, review…) of a publication. |
| DOI / PMID / PMCID | External publication identifiers. |
For developers
The queries above are defined and executed by the
VFBquery engine and can be run
outside the website via its HTTP API and the VFB MCP tools — see
APIs. The engine decides which queries apply to a given entity
from that entity’s classification (its types/tags), which is why the menu differs
between entity types. Each query’s response carries a headers block giving the
column titles used above.